Coherence-controlled holographic microscopy
Raman spectroscopy is based on the Raman effect: when a molecule is exposed to laser light, a small fraction is scattered with a shift in frequency compared to the incident light. This shift is highly specific for each molecule – as unique as a fingerprint.
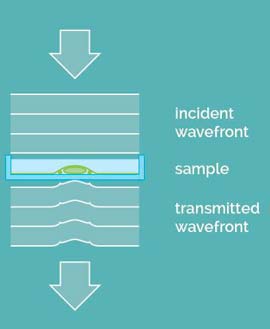
Principles of quantitative phase imaging
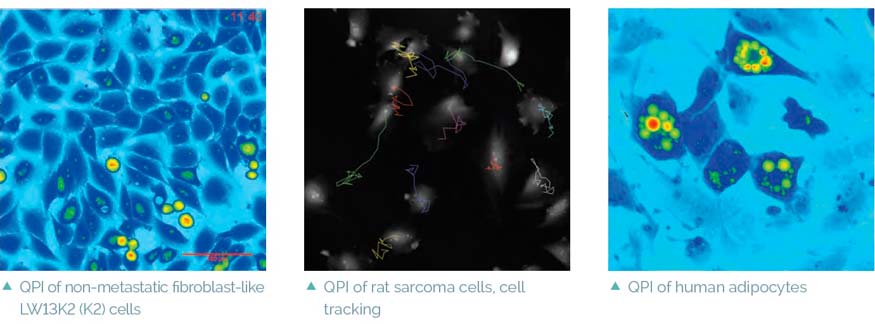
The time of propagation of light in a specific environment depends on the refractive index as well as the distance of the optical path. Therefore, when a light wave travels through a sample with varying refractive index and/or height, its wavefront is distorted and a change in the phase distribution of this wave occurs. The Q-PHASE is able to detect the phase distribution in the sample plane. This process of phase detection in a sample plane is usually referred to as quantitative phase imaging. Quantitative phase image can provide information on sample morphology, topography or cell dry-mass distribution. [5,6] Cell dry mass is quantified in pg/μm2 and can be calculated directly from phase values detected in each pixel. Quantitative phase imaging provides a very simple and sensitive way for monitoring of cell reactions to treatment and analyses of movement, growth, area, shape and many other parameters. Various color LUTs are often used for representation of phase images to easily distinguish different phase values.
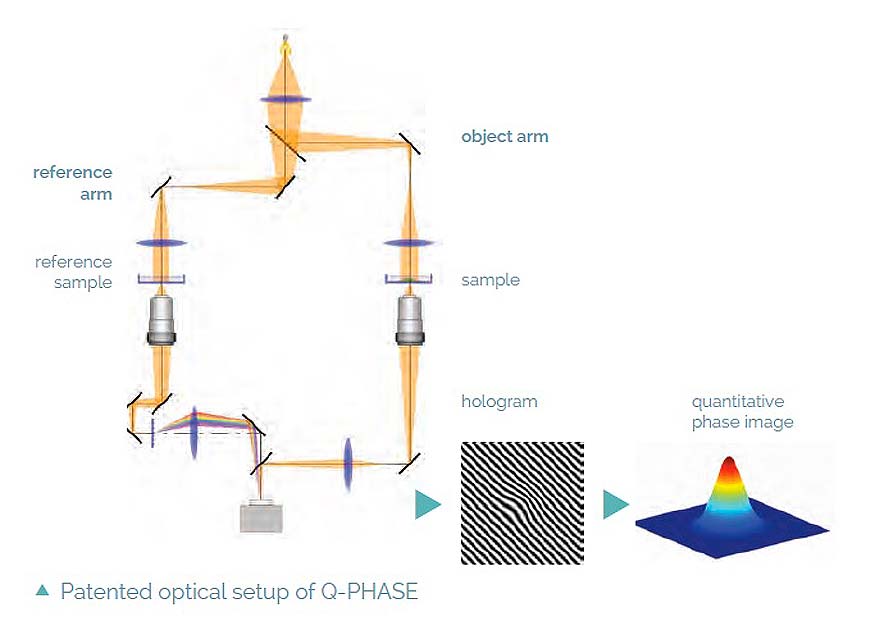
Patented optical setup
The Q-PHASE microscope consists of two arms, object arm and reference arm. The arms have similar microscope setups with a common illumination system. The sample is placed into the object arm, and the so-called reference sample (blank) is placed into the reference arm. The beams in each arm pass through the inserted sample and are combined at the image plane of the microscope. Thanks to the Q-PHASE’s unique patented optical setup, the beams interfere and form a hologram even when illuminated with a halogen lamp or a LED. The hologram is then recorded by a detector and a quantitative phase image is extracted from the hologram in real time by a computer.