The microRNA project now continues exclusively on the Two-Tailed RT-qPCR (TT-PCR) platform.

Technical information describing the performance characteristics and reproducibility for the BioVendor miREIA kits is provided in this note. These characteristics are compared with commonly used commercial qRT-PCR kits.
![]()
Analytical Performance and Reproducibility of miREIA Kits.
Comparison to qPCR.
Introduction
Many microRNAs (miRNAs) are reported as disease markers for various human pathologies, but only a small fraction are translated to routine clinical use. Inter-laboratory variability and the consequent potential for misinterpretation of results seem to be the biggestcontraints of miRNA biomarker functionality. Absolute quantification ensured by exact calibration may solve this problem and help to translate miRNA biomarkers to diagnostic use.To address this problem, BioVendor has launched a novel method for quantification of miRNA based on immunoassay, the miREIA – microRNA Enzyme Immunoassay kit. We believe that exact quantification and excellent reproducibility are the key values of the miREIA kits.For the description and protocols see www.biovendor.com/mirna.
Experimental design
RNA was isolated from whole blood samples obtained from four healthy volunteers. The isolates were aliquoted and miRNA-93-5p and miRNA-23a-3p were measured independently with BioVendor hsa-miR-93-5p miREIA (Ref#: RDM0002H) and hsa-miR-23a-3p miREIA (Ref#: RDM0009H), and commercial qRT-PCR kits. Measurements were repeated five times in five days and reproducibility of the two methods were compared.| miRNA | Sample ID | miREIA CV (%) | qPCR CV dCT (%) |
| miR-93-5p | 1 2 3 4 |
4 14 12 12 |
58 59 49 81 |
| miR-23a-3p | 1 2 3 4 |
8 17 6 5 |
25 19 22 17 |
Results
Run-to-Run Variability
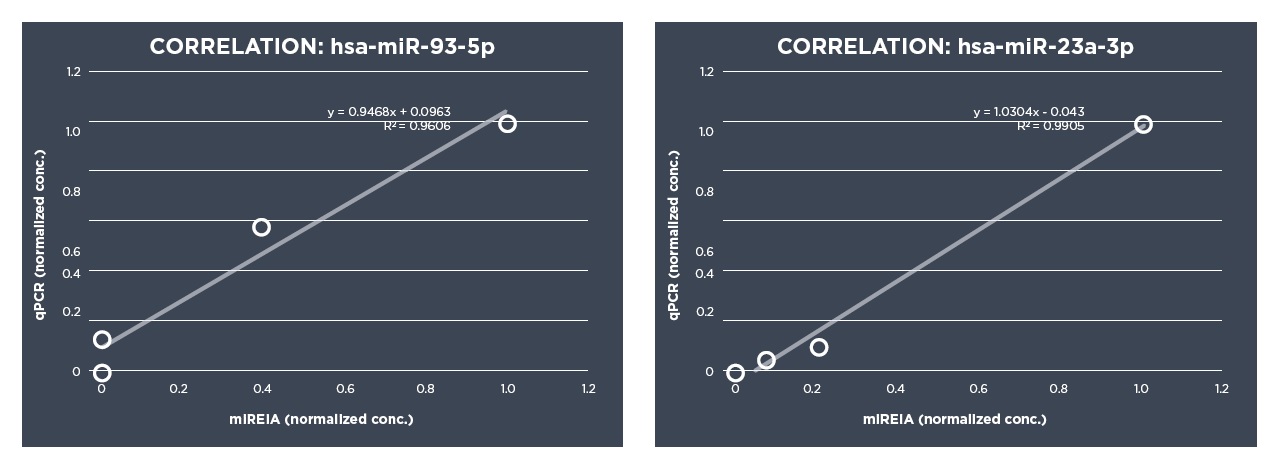
Coefficient of variation (CV) was calculated from average values of absolute concentrations obtained from miREIA or relative concentrations obtained from qRT-PCR measurements. miREIA showed better Run-to-Run reproducibility than qRT-PCR method.Correlations
Good correlations of miREIA and qRT-PCR results were observed as obvious from the correlation graphs.
Conclusions
In the pilot mini-study, the results measured with BioVendor miREIA kits exhibited significantly lower Run-to-Run variations (4–13 % and 5–17 % for hsa-miR-93-5p and hsa-miR-23a-3p, respectively) than results with the qRT-PCR kits (49–81 % and 17–25 % for hsamiR-93-5p and hsa-miR-23a-3p, respectively). Molecular applications such as qRT-PCR use amplification and reverse transcription steps which are characterized by high inter-assay variability compared to immunoassays. In addition, they work with sample volumes in the low microliter (μl) range, further increasing susceptibility to unwanted sample variability.
SUPPLEMENTARY: PERFORMANCE CHARACTERISTICS OF miREIA KITS
RDM0002H hsa-miR-93-5p miREIA
Sensitivity: 0.13 amol/μl
Intra-assay (Within-Run) (n=8)RDM0009H hsa-miR-23a-3p miREIA
Sensitivity: 0.13 amol/μl
Intra-assay (Within-Run) (n=8)
| Sample | Mean (amol/μl) |
SD (amol/μl) |
CV (%) |
| 1 | 3.44 | 0.31 | 9.1 |
| 2 | 0.96 | 0.06 | 7.4 |
| 3 | 0.39 | 0.03 | 8.6 |
| Sample | Mean (amol/μl) |
SD (amol/μl) |
CV (%) |
| 1 | 6.38 | 0.30 | 4.6 |
| 2 | 1.41 | 0.10 | 6.7 |
| 3 | 0.39 | 0.01 | 3.9 |
Inter-assay (Run-to-Run) (n=5)Inter-assay (Run-to-Run) (n=5)
| Sample | Mean (amol/μl) |
SD (amol/μl) |
CV (%) |
| 1 | 848.3 | 34.3 | 4.0 |
| 2 | 361.2 | 43.5 | 12.0 |
| 3 | 43.7 | 5.2 | 12.0 |
| Sample | Mean (amol/μl) |
SD (amol/μl) |
CV (%) |
| 1 | 319.09 | 14.81 | 4.6 |
| 2 | 78.28 | 6.42 | 8.2 |
| 3 | 40.08 | 2.47 | 6.17 |
Spiking RecoverySpiking Recovery
| Sample | Observed (amol/μl) |
Expected (amol/μl) |
Recovery O/E (%) |
| 1 | 50.08 107.40 73.55 54.78 |
- 113.69 80.95 64.93 |
- 94.5 90.9 84.4 |
| 2 | 7.22 12.05 9.75 8.57 |
- 11.83 9.57 8.15 |
- 101.8 101.9 105.1 |
| Sample | Observed (amol/μl) |
Expected (amol/μl) |
Recovery O/E (%) |
| 1 | - 94.5 90.9 84.4 |
- 56.1 42.4 33.64 |
- 96.1 83.8 90.8 |
| 2 | - 101.8 101.8 105.1 |
- 47.51 33.81 25.05 |
- 105.1 25.05 105.9 |
LinearityLinearity
| Sample | Dilution | Observed (amol/μl) |
Expected (amol/μl) |
Recovery O/E (%) |
| 1 | - 2x 4x 8x |
192.08 103.8 45.68 20.88 |
- 96.04 48.02 24.01 |
- 108.1 95.1 87.0 |
| 2 | - 2x 4x 8x |
45.23 23.37 11.55 6.71 |
- 22.61 11.31 5.65 |
- 103.3 102.2 118.6 |
| Sample | Dilution | Observed (amol/μl) |
Expected (amol/μl) |
Recovery O/E (%) |
| 1 | - 2x 4x 8x |
25.93 13.52 6.33 3.98 |
- 12.97 6.48 3.24 |
- 104.3 97.6 122.8 |
| 2 | - 2x 4x 8x |
58.01 28.46 14.90 8.41 |
- 29.01 14.50 7.25 |
- 98.1 102.7 116.0 |
References
1. Kappel A et al. MicroRNA in vitro diagnostics using immunoassay analyzers. Clin Chem. 2015 Apr;61(4):600-7.2. Costa MC et al. MicroRNA profiling in plasma or serum using quantitative RT-PCR. Methods Mol Biol. 2014;1182:121-9.
3. Marabita F et al. Normalization of circulating microRNA expression data obtained by quantitative real-time RT-PCR. Brief Bioinform. 2016 Mar;17(2):204-12.